

CPL Theater: Why Your LinkedIn Cost Per Lead Is Lying
Cost per lead is cheap to report and easy to move the wrong way. It falls when lead quality falls, which is why a falling CPL and a falling close rate usually arrive together.
Your LinkedIn Ads report says cost per lead is $95 and trending down. Your CRM says those leads close at 0.4%. Both numbers are correct, and that is exactly the problem. CPL is the cheapest metric in this category to produce and the easiest to move in the wrong direction, so it became the number that lands on slide two of every monthly report. CPL theater is what happens when reporting serves the chart that is easy to show instead of the question the CFO actually asked, which is: which campaigns produced revenue?
A falling cost per lead is not evidence of progress. It is evidence that something got cheaper, and nobody checked what.
What CPL theater actually is
CPL theater is reporting cost per lead as the headline outcome of a paid campaign when the buyer’s actual outcome is pipeline. It is not fraud. Nobody invents numbers. The spend is real, the lead count is real, and the division is arithmetically correct. The dishonesty is structural: the metric is presented as a proxy for performance when it is only a proxy for friction.
Three tells give it away, and you can spot all three in a monthly report without account access.
- The report ends at the lead. There is no column for sales-accepted, opportunity, or closed-won, because none of those live in Campaign Manager unless somebody wired them there.
- The CPL number improves month over month while the sales team’s complaints get louder. Those two facts are usually the same fact.
- The word “attribution” appears on the agency’s service page but the only artifact you have ever received is a dashboard screenshot. A dashboard is a view. Attribution is a data path.
The reason this survives is that it works for everyone in the room except the person paying. The agency gets a metric that improves under its own control. The marketing manager gets a slide that does not require a fight with sales. The platform gets a target it can actually hit. The CFO gets nothing.
The arithmetic: two vendors, the same $40,000
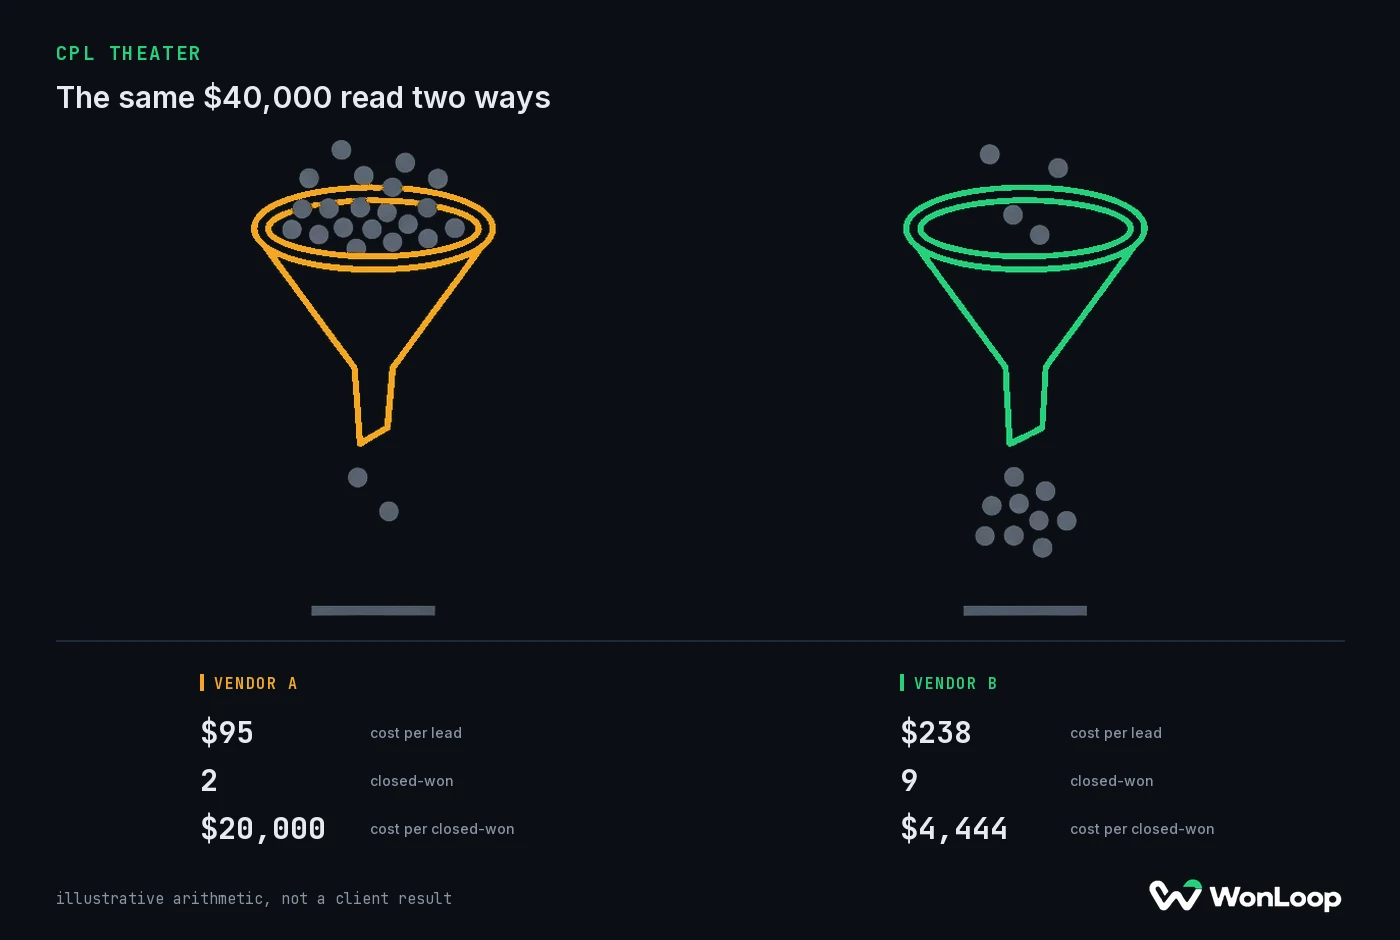
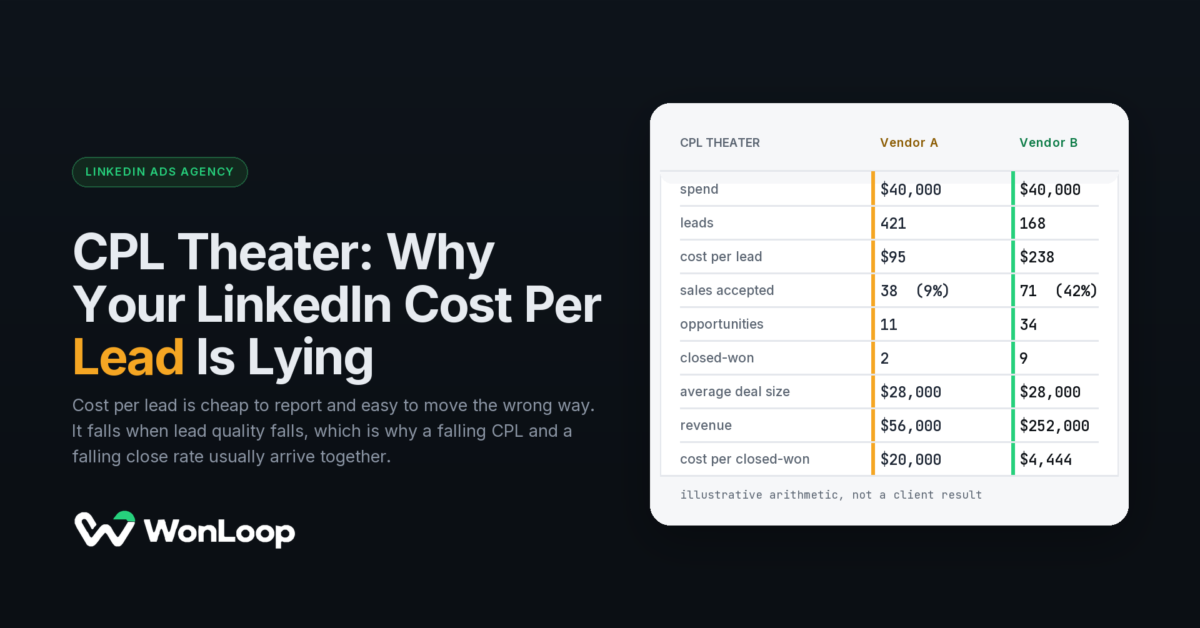
Here is the argument as numbers. Two vendors each spend $40,000 in a quarter on the same audience with the same average deal size. One reports a CPL 60% cheaper. The other produces four and a half times the revenue.
CPL THEATER
the same $40,000 read two ways
| Metric | Vendor A | Vendor B |
|---|---|---|
| spend | $40,000 | $40,000 |
| leads | 421 | 168 |
| cost per lead | $95 | $238 |
| sales accepted | 38 (9%) | 71 (42%) |
| opportunities | 11 | 34 |
| closed-won | 2 | 9 |
| average deal size | $28,000 | $28,000 |
| revenue | $56,000 | $252,000 |
| cost per closed-won | $20,000 | $4,444 |
illustrative arithmetic, not a client result
Vendor A wins every slide that ends at the lead. Vendor B wins the only line the business cares about: $4,444 to acquire a customer versus $20,000. The gap is not effort, budget, or creative talent. It is what each account taught the algorithm to go find.
Run this on your own numbers before you read any further. You need four figures: spend, leads, closed-won deals, and average deal size. Divide spend by closed-won. If that number is uncomfortable and your CPL is not, you have found CPL theater in your own reporting.
Why cost per lead falls when lead quality falls
This is the mechanism, and it is not a metaphor. LinkedIn’s delivery algorithm bids toward the conversion event you defined in Campaign Manager, under Measure, then Conversion tracking. If the only event you defined is a form submission, the algorithm’s entire understanding of success is “this member submitted a form.” It will then get very good at finding members who submit forms.
Members who submit forms readily are not the same population as members who buy. Native Lead Gen Forms pre-fill from the profile, so the friction of converting drops to two taps. That is a genuine advantage when you want volume and a genuine hazard when you want pipeline, because friction was doing some of your qualifying for free. Remove it and CPL falls, which reads as improvement, while intent falls with it, which reads as nothing at all because nothing in the report measures intent.
The second half of the mechanism is starvation. LinkedIn needs roughly 50 conversion events per campaign per month to exit the learning phase and deliver against a stable signal. Cheap, low-intent events are the easiest way to hit that threshold, so an account bidding toward form fills will look statistically healthier than one bidding toward opportunities, which may never reach 50 events a month at all. The fix is not to abandon the deep event. It is to push CRM stages back into LinkedIn so the platform learns from MQL, SQL, opportunity and closed-won instead of guessing from form fills. LinkedIn’s Conversions API documentation covers the server-side path that makes those events deliverable.
The four numbers that replace cost per lead
Replacing CPL does not mean adding more metrics. It means reporting the four that answer questions someone outside marketing actually asks. Every one of them requires the CRM and the ad platform to be joined, which is precisely why they are rare.
| Metric | The question it answers | What it needs |
|---|---|---|
| Cost per sales-accepted lead | Is the lead quality real, or does sales reject it? | CRM stage change pushed back as a conversion event |
| Cost per opportunity | Which campaigns create pipeline rather than activity? | Opportunity stage import, plus a 90-day reporting window |
| Cost per closed-won | What did a customer cost us? | Closed-won import and deal amount |
| Pipeline per $1,000 spent | Is the channel worth funding next quarter? | Deal value joined to the campaign that sourced it |
Notice the pattern in the right-hand column. None of these need a new tool. Dreamdata and Factors.ai both have real free tiers, and HubSpot and Salesforce already hold every stage transition you need. Access to attribution is close to free. Implementation is the work, and it is the part nobody ships.
Run the check on your own account this week
You can diagnose this yourself in about twenty minutes. No agency required.
- Open Campaign Manager, go to Measure, then Conversion tracking. List every rule, its data source, and its counting method. Write down how many of them represent a CRM stage rather than a page view or a form submit. In most accounts the answer is zero.
- Check the last-fired date on each rule. Rules that have not fired in 60 days are still shaping delivery on any campaign pointed at them.
- In your CRM, filter deals closed in the last four quarters where the source is LinkedIn. Count them. Compare that count to the conversions Campaign Manager reports for the same period. The two numbers should be reconcilable. If they differ by an order of magnitude, the platform is bidding against a signal that does not describe your business.
- Divide total LinkedIn spend for those quarters by the number of closed-won deals. That is your real cost per customer. Put it next to your reported CPL on the same slide, permanently.
If step three is where it falls apart, the problem is the data path, not the campaigns. Our signal checker shows what your site is firing today, and the free tracking check walks the same four steps against your account and returns the gap in writing.
Where cost per lead is still a useful number
Killing CPL entirely would be its own kind of theater. It remains the right metric in three situations, and pretending otherwise would be dishonest.
Creative testing inside a single campaign is one. When audience, offer and landing page are held constant and only the image or headline changes, CPL is a clean, fast read on which creative earns attention. It answers a narrow question well.
Early diagnostics are another. A CPL of $600 on a $40,000 deal is not automatically bad, but a CPL of $600 where it was $110 last month is a signal worth chasing the same day. Direction matters even when the level does not.
The third is short-cycle offers where the form fill genuinely is the outcome — a webinar registration measured on attendance, for instance. The rule is simple: CPL is a diagnostic, never a scoreboard. The moment it appears as the headline number in a report to someone who controls budget, it has stopped describing the business and started performing for it.
The bottom line
A healthy cost per lead and a 0.4% close rate are not two separate problems to solve in sequence. They are one problem seen from two sides. The account was told that a form fill is success, the algorithm believed it, and the reporting layer confirmed it every month. Nothing in that loop can detect the deals that never happened.
Breaking the loop is a plumbing job, not a strategy engagement. Define conversion rules that map to CRM stages, send them server-side so they survive ad blockers and cookie loss, import the stages your sales team already records, and put cost per closed-won on the same slide as CPL. The campaigns can stay exactly as they are while you do it, which is why this is the first change we make and not the last.
That is the whole scope of LinkedIn Signal Repair: fixed price, 14 days, and a written before-and-after showing the conversion volume the account was losing. The guarantee is one line: if conversion events per 1,000 clicks recorded in Campaign Manager don't rise at least 15% over your trailing 30-day pixel-only baseline, you pay nothing. Signal Repair itself has no spend floor; we don't take campaign management below $8,000 a month in LinkedIn spend, because under that number the arithmetic on this page stops working in your favor.